
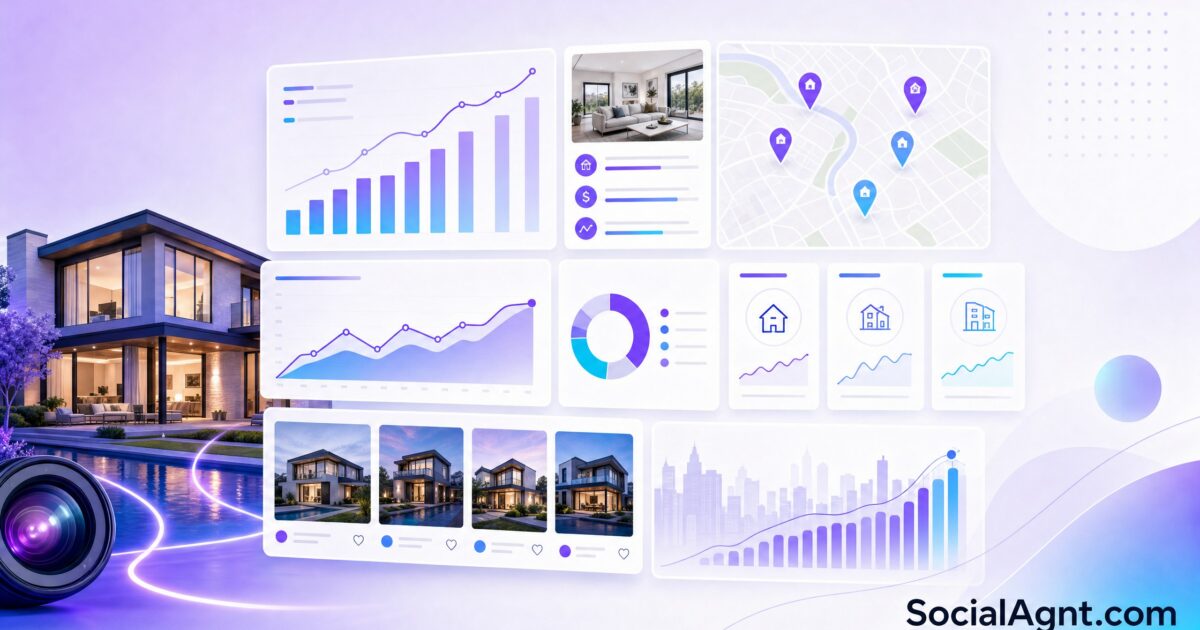
Key Takeaways: Infographics are one of the most effective content formats for real estate agents on social media — generating 650 percent more engagement than text-only content and being shared 300 percent more often than articles. Yet most agents overlook them entirely, relying on listing photos and text posts while missing an opportunity to establish expertise through data visualization. The reason infographics work so well in real estate is that market data is inherently complex and intimidating to most consumers — median prices, inventory levels, days on market, interest rate impacts, and neighborhood comparisons are exactly the type of information that becomes accessible and shareable when presented visually rather than in paragraphs of text. You do not need design expertise or expensive software to create effective infographics. Tools like Canva provide templates specifically designed for real estate content, and the design principles that make infographics readable and shareable are straightforward once you understand them. This guide covers the types of real estate infographics that perform best on social media, the design principles that make them effective, the tools you need to create them, and how to integrate infographics into your content strategy for maximum impact.
Why Infographics Outperform Other Content Types in Real Estate
The human brain processes visual information approximately 1,000 times faster than text. This biological reality is the foundation of why infographics consistently outperform text-based content on social media. When a potential client scrolls past a text post about median home prices in their neighborhood, they might glance at it and keep scrolling. When they encounter a well-designed infographic that visualizes the same data with clear charts, color-coded comparisons, and easy-to-read numbers, they stop, absorb the information, and often share it with others.
The engagement data supports this at every level. Social posts with infographics generate 650 percent more engagement than text-only content. Infographics are shared 300 percent more often than text articles. Seventy percent of social media users prefer learning through infographics rather than reading text, and 61 percent of consumers find infographics the most effective way to retain information. For real estate agents, these numbers translate directly into more visibility, more shares, more profile visits, and ultimately more leads.
Real estate is particularly well-suited to infographic content because the industry generates enormous amounts of data that consumers need but struggle to interpret. Monthly market statistics, price trend comparisons, neighborhood demographic data, mortgage rate impacts, and transaction process timelines are all information that potential buyers and sellers actively seek — and all information that is significantly more accessible in visual format than in written paragraphs.
The Seven Types of Real Estate Infographics That Get Shared
Not all infographic topics perform equally. The types that generate the most engagement and shares in real estate fall into seven categories, each serving a different purpose in your content strategy.
Monthly Market Snapshots
A monthly infographic summarizing your local market data is the single most valuable recurring infographic you can create. Include median home price and month-over-month change, average days on market, number of active listings, number of homes sold, and the list-to-sale price ratio. Present these numbers with simple visual indicators — up arrows in green for positive trends, down arrows in red for declines, and clear year-over-year comparisons. This infographic establishes you as the local market expert and gives your audience a reason to follow you for ongoing updates.
Process Explainers
The home buying and selling process is confusing for most consumers, and a visual step-by-step guide through any part of the process provides genuine value. Create infographics that walk through the home buying timeline from pre-approval to closing. Visualize the home selling process from listing preparation to closing day. Explain what happens during a home inspection with a visual checklist. Break down the mortgage application process into manageable steps. These educational infographics position you as a helpful guide rather than a salesperson and are among the most-saved content types on Instagram and Pinterest.
Neighborhood Comparisons
Side-by-side comparisons of neighborhoods in your market area help potential buyers evaluate their options at a glance. Compare median home prices, school ratings, average commute times, walkability scores, population demographics, and notable amenities across two or three neighborhoods. These infographics are highly shareable because they serve a practical purpose for anyone considering a move to your area — and they demonstrate deep local knowledge that differentiates you from agents who market generically.
Cost Breakdowns
Financial complexity is one of the biggest barriers for homebuyers, and infographics that break down costs visually reduce anxiety and build confidence. Create visual breakdowns of closing costs explaining what each fee covers and typical ranges. Show what a monthly mortgage payment includes — principal, interest, taxes, insurance, and any HOA fees — with a pie chart or stacked bar chart. Visualize the true cost of homeownership beyond the mortgage payment. These infographics are among the most saved and shared because they answer questions people are often too embarrassed to ask.
Market Trend Timelines
Historical data presented as a visual timeline helps your audience understand where the market is heading. Create line charts showing price trends over the past one, three, or five years in your market. Visualize interest rate changes and their impact on buying power. Show seasonal patterns in listing activity and sale prices. Timeline infographics work particularly well because they provide context that single-month data points cannot — they help your audience understand whether current conditions represent a trend or an anomaly.
Myth-Busting Graphics
Take common real estate misconceptions and debunk them visually. Create side-by-side comparisons of what people believe versus what the data actually shows. The classic example is the 20 percent down payment myth — visualize the range of actual down payment options alongside the percentage of buyers who put down less than 20 percent. These infographics generate engagement because they challenge assumptions and provide surprising information that people want to share with friends and family who hold the same misconceptions.
Seasonal and Event-Based Infographics
Create infographics tied to seasonal events and market milestones. Spring buying season preparation checklists, holiday home maintenance guides, end-of-year market recaps, and back-to-school neighborhood guides all provide timely value while demonstrating your awareness of the seasonal rhythms that affect real estate decisions. These infographics have a natural sharing incentive because they align with what people are already thinking about at specific times of year.
Market Data, Visualized Automatically
SocialAgnt transforms your local market data into shareable, branded infographic content without requiring any design skills. From monthly market snapshots to neighborhood comparisons, AI-powered content generation creates visual posts that establish your expertise and drive engagement across every platform. See how SocialAgnt turns market data into social media content.
Design Principles That Make Infographics Effective
You do not need to be a graphic designer to create effective infographics. You need to understand and apply a few foundational principles that separate professional-looking content from amateur attempts.
Visual Hierarchy: Guide the Eye
Every infographic should have a clear visual hierarchy that guides the viewer’s eye from the most important information to the supporting details. Think of your content in three layers. The first layer — what must be seen — includes your headline, the primary data point, and the main takeaway. This content should be the largest, boldest, and most prominently placed. The second layer — what should be seen — includes supporting statistics, comparisons, and context. This content is smaller but still clearly readable. The third layer — what can be seen — includes source citations, secondary details, and your branding. This content is the smallest and least prominent.
Arrange these layers so the viewer’s eye naturally moves from top to bottom and from most important to least important. If your infographic is about median home prices, the current median price should be the largest number on the graphic. The month-over-month and year-over-year changes should be smaller but clearly visible. Source information and your logo should be at the bottom.
Simplicity Over Complexity
The most common mistake agents make with infographics is trying to include too much information. An effective infographic communicates one central idea clearly. If you need to present five different market metrics, create five separate infographics rather than cramming them all into one. Your audience should understand the main message at a glance — if they need to study the graphic for more than a few seconds to get the point, it is too complex.
Use images, icons, charts, and graphs instead of text wherever possible. If you find yourself writing multiple sentences to explain something, the visualization is not doing its job. Replace paragraph explanations with charts. Replace lists of numbers with bar graphs. Replace text descriptions of processes with visual flowcharts. The less text your infographic contains, the more effective it will be.
White Space Is Your Friend
White space — the empty area around and between elements in your design — is one of the most powerful and most underused design tools. Generous white space makes your infographic easier to read, less overwhelming, and more professional in appearance. Resist the urge to fill every available pixel with content. Let your data points breathe. Maintain consistent margins around the edges and consistent spacing between sections. When in doubt, add more space rather than more content.
Consistency Builds Trust
Maintain consistent design elements across all your infographics. Use the same color palette, the same fonts, the same icon style, and the same layout structure. This consistency serves two purposes: it builds brand recognition so your audience immediately knows the infographic is from you, and it projects professionalism that reinforces your credibility as a market expert. When you create a monthly market snapshot, each month’s version should follow the same template with updated data — your audience will come to expect and look for it.
Color, Typography, and Layout Best Practices
Three design elements — color, typography, and layout — account for most of the visual impact of your infographics. Getting these right elevates your content from amateur to professional.
Color Strategy
Limit your color palette to three to five complementary colors. Your primary brand color should anchor the design, with two to three secondary colors used for charts, highlights, and accent elements. Use color intentionally to direct attention — a bright accent color on the most important data point draws the eye there first. Use distinct colors for different data categories so viewers can immediately tell them apart in charts and comparisons.
One critical consideration that most agents overlook: approximately 8 percent of men and 0.5 percent of women have some form of color blindness. If your infographic relies solely on color to distinguish between data categories — red for one trend and green for another, for example — a meaningful portion of your audience cannot read it correctly. Always use additional visual cues alongside color, such as different patterns, shapes, or labels, to ensure your data is accessible to everyone.
Typography That Works
Limit yourself to two fonts maximum — one for headings and one for body text. Choose fonts that are easy to read at all sizes, especially smaller sizes that you will use for supporting data and source information. Create a clear three-level hierarchy: your main headline should be the largest and most prominent, section headings should be clearly distinguishable from body text but smaller than the main headline, and body text should be the smallest size that remains comfortably readable.
Ensure sufficient contrast between your text and background. Dark text on light backgrounds is almost always more readable than light text on dark backgrounds, particularly for data-heavy content. If your brand colors include a dark background, reserve it for headlines and use lighter backgrounds for sections with detailed data.
Layout Principles
Organize your infographic using a clear grid system that creates visual alignment between elements. Elements that are related should be visually grouped together through proximity — placed close to each other with space separating them from unrelated elements. Maintain consistent alignment throughout the design — if your section headings are left-aligned, keep them all left-aligned. If your data points are centered, center all of them.
For social media, pay attention to platform-specific dimensions. Instagram feed posts work best as squares at 1080 by 1080 pixels or vertical rectangles at 1080 by 1350 pixels. Instagram Stories and Reels use a vertical format at 1080 by 1920 pixels. Pinterest favors tall vertical pins. Facebook posts perform well in landscape format at 1200 by 630 pixels. Design your infographic for the platform where it will be posted, or create multiple versions optimized for each platform.
Tools for Creating Real Estate Infographics
You do not need Adobe Illustrator or professional design training to create effective infographics. Several tools make the process accessible to anyone with basic computer skills.
Canva
Canva is the most widely used infographic creation tool for real estate agents, and for good reason. Its massive template library includes hundreds of infographic designs that can be customized with your brand colors, fonts, and data. The drag-and-drop editor requires no design experience, and the platform includes basic chart and graph tools that let you visualize data without external software. Canva’s brand kit feature stores your colors, fonts, and logo for consistent application across all designs. The free tier is sufficient for most agents, with Pro features available for additional templates and collaboration tools.
Piktochart
Piktochart is purpose-built for data visualization and infographics, making it the stronger choice for agents who create data-heavy market reports and analytical content. Its block-based editing approach lets you edit sections independently, and its built-in chart tools are more sophisticated than Canva’s — supporting more chart types and more customization options. If your infographic strategy leans heavily toward market data visualization, Piktochart’s specialized tools may be worth the investment.
Venngage
Venngage offers a middle ground between Canva’s simplicity and Piktochart’s data focus. It provides real estate-specific templates, a robust icon library, and collaboration features for teams. The platform’s strength is in creating visually consistent series of infographics — useful for agents who want their monthly market updates, neighborhood comparisons, and educational content to share a cohesive visual identity.
Using Templates Effectively
Starting with a template is not cheating — it is smart design practice. Professional designers use templates and frameworks as starting points, and you should too. The key is customization: change the colors to match your brand, replace placeholder data with your actual market numbers, and adjust the layout to fit your specific content. A template that you have customized with your brand elements and local data will look professional and unique, even though the underlying structure was created by someone else.
Integrating Infographics Into Your Content Strategy
Infographics should not be a separate content effort — they should be integrated into your overall social media strategy as a recurring content type that complements your other posts.
The Monthly Market Snapshot Cadence
Commit to creating one market snapshot infographic per month. Use the same template each month, updating it with current data. Publish it on the same day each month — the first Monday, for example — so your audience comes to expect and look for it. Over time, this single recurring infographic becomes a signature content piece that your followers associate with your brand. It also creates a built-in content archive — months of market snapshots that collectively tell the story of your market’s trajectory.
Educational Infographic Series
Create a series of educational infographics that you can repurpose over time. A ten-part series on the home buying process, a five-part series on preparing a home for sale, or a series of neighborhood comparison guides all provide weeks of content that you create once and repost periodically. Because educational content remains relevant for months or years, these infographics continue providing value long after their initial publication.
Repurposing for Maximum Reach
A single infographic can serve multiple content purposes across platforms. Post the full infographic on Instagram as a carousel or single image. Extract individual data points and create separate posts highlighting each one. Convert key statistics into Instagram or Facebook Stories with animated elements. Include the infographic in your email newsletter. Print it for your office or for distribution at open houses. Share sections of it in Facebook Group discussions when relevant questions arise. One well-designed infographic can generate five to ten separate pieces of content across channels.
Combining Infographics With Other Content
Infographics work best as part of a varied content mix. Pair your market snapshot infographic with a video commentary explaining what the numbers mean and what they recommend for buyers and sellers. Follow an educational infographic with a personal story about a transaction that illustrates the process you just visualized. Use an infographic as the visual anchor for a longer blog post or article that provides the detailed analysis behind the data. The infographic catches attention and communicates the headline — your supporting content provides the depth.
Professional Infographics Without the Design Work
SocialAgnt creates branded, data-driven infographic content for your social media profiles using AI that understands real estate market data. From monthly market snapshots to neighborhood comparisons, your content is designed to drive engagement and establish your authority — without hours in Canva or Piktochart. Try SocialAgnt free and see AI-designed infographic content for your market.
Common Infographic Mistakes and How to Avoid Them
Understanding the most common mistakes helps you create infographics that stand out from the amateur content that dominates most agents’ social media feeds.
Information Overload
The most frequent mistake is trying to communicate too many ideas in one infographic. When everything is highlighted, nothing is highlighted. Each infographic should have one clear message supported by relevant data. If your monthly market data includes ten metrics, create two or three focused infographics rather than one overwhelming graphic. Your audience will engage more deeply with three simple graphics than with one complicated one.
Inconsistent Branding
Using different colors, fonts, and styles for each infographic prevents your audience from building brand recognition. Establish your visual identity — brand colors, two fonts, logo placement — and apply it consistently to every infographic you create. Save your brand elements as templates or presets in your design tool so consistency happens automatically.
Poor Data Sourcing
Infographics that present data without citing sources undermine your credibility. Always include source information on your infographics, even if it is in small text at the bottom. Use reputable, current sources for your data — your local MLS for market statistics, government sources for demographic data, and recognized industry organizations for broader market trends. When your audience trusts your data, they trust your expertise.
Ignoring Mobile Readability
Most of your audience will view your infographic on a mobile device. Text that is readable on a desktop monitor may be illegibly small on a phone screen. Test every infographic on your own phone before posting. If any text is difficult to read at the size it appears on a mobile screen, increase the font size or simplify the content. For platforms like Instagram where images are displayed in a fixed square or vertical format, ensure your most important information is large enough to be read without zooming.
Creating Without Purpose
Every infographic should serve a clear purpose in your content strategy — establishing market expertise, educating potential clients, driving engagement, or supporting lead generation. Creating infographics because they are visually appealing without connecting them to a strategic goal wastes time and dilutes your content. Before creating an infographic, ask yourself: what do I want my audience to know, feel, or do after seeing this? If you cannot answer clearly, refine your concept before opening your design tool.
Getting Started: Your First Five Infographics
If you are new to creating infographics, start with these five types that provide the strongest combination of value, shareability, and ease of creation.
First, create a monthly market snapshot for your primary market area using current data from your local MLS. This becomes your recurring monthly content piece. Second, design a home buying process timeline that walks first-time buyers through the journey from pre-approval to closing day in visual steps. Third, build a neighborhood comparison infographic that puts two popular neighborhoods in your market side by side with key metrics. Fourth, create a cost breakdown showing what a typical monthly mortgage payment includes for a median-priced home in your area. Fifth, design a myth-busting graphic that addresses the most common misconception you encounter with clients.
These five infographics give you a foundation of content that you can share, repurpose, and build upon. Once you have created them, you will have a working knowledge of your design tool, an understanding of what resonates with your audience, and a template system that makes creating future infographics significantly faster. The first infographic takes the longest — by the fifth, you will have a process that lets you create professional-quality data visualizations in under an hour.
Ready to save 5+ hours per week on social media?
SocialAgnt helps real estate agents schedule posts, create AI content, and grow their brand across 7 platforms. Try it free for 14 days.
