
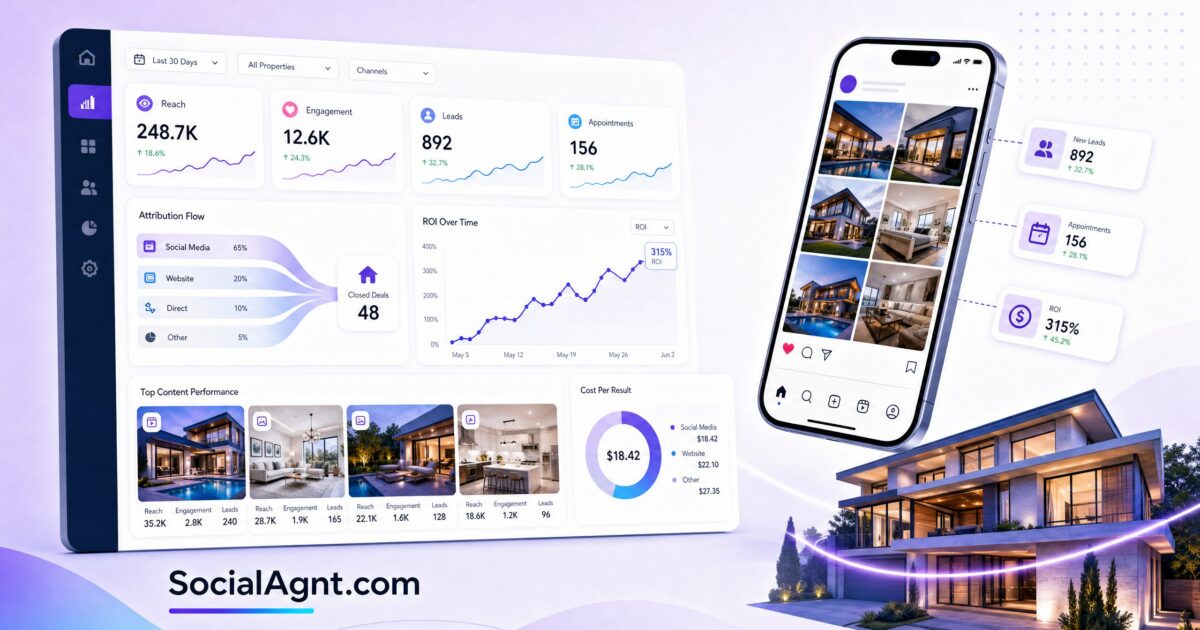
Key Takeaways: Real estate social media analytics is where most agents fall short — they post content consistently but never measure what’s working, what isn’t, and whether their social media efforts are actually contributing to revenue. Without analytics, you’re marketing blind: spending time and money on strategies that might be generating business or might be completely wasted. This guide explains exactly which metrics matter for real estate agents (and which are vanity metrics that don’t predict revenue), how to track performance across platforms, how to calculate the true ROI of your social media investment, and how to use data to make smarter marketing decisions that directly impact your bottom line.
Why Most Agents Get Social Media Analytics Wrong
The most common mistake real estate agents make with social media analytics is obsessing over the wrong numbers. Followers. Likes. Impressions. These are the metrics that platforms highlight because they feel good and keep you using the platform — but they have a weak correlation with actual real estate business outcomes.
An agent with 10,000 Instagram followers and zero clients from social media has a vanity problem, not a marketing strategy. An agent with 800 followers who generates three closings per year from social media has a business asset. The difference between these two agents isn’t follower count — it’s understanding which metrics actually predict revenue and optimizing for those metrics instead of the ones that make you feel popular.
Effective social media analytics for real estate connects your social media activity to business outcomes through a clear chain: content → reach → engagement → leads → appointments → closings → revenue. Every metric you track should map to one of these stages. If a metric doesn’t connect to this chain, it’s entertainment, not information.
The Metrics That Actually Matter for Real Estate
Organize your analytics into three tiers: leading indicators (predict future results), conversion metrics (measure business-relevant actions), and revenue metrics (tie directly to income). Each tier builds on the one before it.
Tier 1: Leading Indicators
These metrics tell you whether your content is working — reaching the right people and resonating with them. They don’t directly generate revenue, but declining leading indicators predict declining business outcomes in the future.
Reach: The number of unique people who saw your content. This is more meaningful than impressions (which counts repeat views). Growing reach means your content is being distributed to new audiences — the first requirement for generating new business. Track reach weekly and monthly, looking for consistent growth trends.
Engagement rate: The percentage of people who interact with your content (likes, comments, shares, saves) relative to the number who saw it. Engagement rate is more useful than raw engagement numbers because it normalizes for audience size. A post that reaches 500 people and gets 50 engagements (10% rate) is performing better than a post that reaches 5,000 people and gets 100 engagements (2% rate). For real estate content, an engagement rate of 3–6% on Instagram is strong. Below 1% suggests your content isn’t resonating with your audience.
Saves and shares: These are the highest-value engagement signals on most platforms. A save means someone found your content useful enough to reference later — a strong intent signal. A share means someone found it valuable enough to recommend to their network — the most powerful organic distribution mechanism. Track saves and shares separately from likes, and prioritize creating content that drives these specific actions.
Profile visits: How many people visit your profile after seeing your content. A high ratio of profile visits to reach means your content is compelling enough to make people want to learn more about you — the step between seeing your content and deciding to follow or contact you.
Follower growth rate: Net new followers per week or month. Steady growth indicates your content strategy is attracting and retaining new audience members. Track the rate (percentage growth) rather than the absolute number — adding 50 followers when you have 500 (10% growth) is more significant than adding 50 when you have 5,000 (1% growth).
Tier 2: Conversion Metrics
These metrics measure actions that bridge the gap between social media engagement and real estate business activity. They’re the leading edge of revenue generation.
Link clicks: How many people click from your social media profiles or content to your website, landing page, or lead capture form. This is the moment a passive social media viewer becomes an active prospect. Track link clicks by platform to understand which channels drive the most traffic to your business.
Lead magnet downloads: How many people exchange their contact information for your free resources (buyer guides, market reports, home valuations, checklists). This is a primary conversion metric — the moment a follower becomes a lead in your database. Track downloads by lead magnet type to understand which offers resonate most with your audience.
DM conversations: The number of meaningful DM conversations you have per week — both inbound (people messaging you) and outbound (conversations you initiate based on engagement signals). DM conversations are where social media relationships convert into real estate relationships. Track volume and note which conversations result in next-step actions (phone calls, consultations, or email exchanges).
Consultation or appointment requests: The number of people from social media who schedule a buyer consultation, listing appointment, or introductory call. This is your highest-value conversion metric — it’s the direct bridge between social media and revenue-generating activity.
Email list growth from social: How many new email subscribers come from social media channels specifically. This tracks the flow from social audience (which you don’t own) to email audience (which you do own).
Tier 3: Revenue Metrics
These are the metrics that connect social media directly to your income. They’re the ultimate measure of whether your social media investment is generating a return.
Leads by source: How many total leads can you trace back to each social media platform? This requires asking every lead “How did you find me?” and recording the answer in your CRM. Over time, you’ll have data that shows: “Instagram generated 45 leads this quarter, Facebook generated 22, LinkedIn generated 8, TikTok generated 15.”
Lead-to-client conversion rate by source: What percentage of leads from each platform become paying clients? This is crucial because not all leads are equal. You might generate more leads from Facebook ads, but your Instagram DM leads might convert at three times the rate because they’ve built a longer relationship with your content before reaching out. Track conversion rates by platform to understand lead quality, not just lead volume.
Revenue attribution: Total commission revenue from clients who originated from social media. This is the ultimate ROI number. If you spent $500/month on social media marketing (tools, ad spend, content creation time valued at your hourly rate) and generated $50,000 in commissions from social media-sourced clients over the year, your ROI is substantial and measurable.
Cost per acquisition (CPA): Your total social media investment divided by the number of clients acquired through social media. This is how you compare social media’s efficiency to your other marketing channels — referrals, paid leads (Zillow, Realtor.com), open houses, direct mail, and sphere of influence marketing. When your social media CPA is lower than your other channels’ CPAs, you know where to invest more.
Platform-Specific Analytics Deep Dive
Instagram Analytics
Instagram’s Professional Dashboard (available on business and creator accounts) provides insights on: content reach and impressions by post, engagement breakdown (likes, comments, shares, saves), profile visits and website clicks, follower demographics (age, gender, location, active times), and individual Reel and Story performance. Check your Instagram insights weekly. Pay particular attention to reach trends (is your content reaching more people over time?) and save/share ratios (which content is valuable enough to save or share?). Use the “active times” data to optimize your posting schedule — publish when your specific audience is online.
Facebook Analytics
Facebook’s Meta Business Suite provides insights on: page reach and engagement, post performance by format and topic, audience demographics and location, and actions taken (website clicks, calls, messages). For Facebook, focus on engagement quality rather than reach — Facebook’s organic reach is limited, so the value is in deep engagement (comments, shares, meaningful reactions) rather than broad exposure. Track messages and call button clicks as your primary conversion metrics.
TikTok Analytics
TikTok’s analytics (available on business accounts) show: video views and reach, average watch time and completion rate, audience demographics, traffic source types (For You page, following feed, search), and profile views. TikTok’s most important metric is average watch time relative to video length. If your 30-second videos have an average watch time of 25 seconds, your content is compelling. If it’s 5 seconds, your hooks need work. Also monitor “searched content” as a traffic source — this indicates people are finding your videos through TikTok search, which means your content is ranking for relevant keywords.
LinkedIn Analytics
LinkedIn provides insights on: post impressions and engagement, follower demographics (job titles, companies, industries, locations), and profile views. LinkedIn’s unique value is the professional demographic data. Track which job titles and industries engage with your content — this tells you whether you’re reaching the high-income professionals, relocation candidates, and referral partners that make LinkedIn valuable for real estate.
YouTube Analytics
YouTube Studio provides the most detailed analytics of any platform: watch time (total and average per video), audience retention curves (showing exactly where viewers drop off), traffic sources (search, suggested videos, external), click-through rate on thumbnails, subscriber growth by video, and revenue data if you’re monetized. For real estate agents, the most important YouTube metrics are search traffic (which videos are being found through YouTube and Google search) and audience retention (which videos hold attention and which lose viewers). Search traffic indicates your SEO is working. High retention indicates your content is genuinely valuable.
SocialAgnt aggregates your social media performance across Instagram, Facebook, TikTok, LinkedIn, YouTube, and Google Business Profile into a single analytics dashboard — so you can see what’s working across all platforms without logging into six different apps. Track engagement, reach, and growth from one place. Start free today.
Calculating Your Social Media ROI
ROI (Return on Investment) is the metric that tells you whether your social media efforts are profitable. For real estate agents, calculating social media ROI requires accounting for both your costs and your returns.
Calculating Your Total Social Media Investment
Time investment: Estimate the hours you spend on social media per week (content creation, engagement, DMs, analytics). Multiply by your effective hourly rate (your annual gross commission income divided by your total working hours). If you earn $150,000/year and work 2,000 hours, your hourly rate is $75. If you spend 5 hours/week on social media, that’s $375/week or $19,500/year in time investment.
Tool costs: Add up your monthly subscriptions for social media management platforms, design tools, video editing software, and any other tools used specifically for social media. If your total tool cost is $100/month, that’s $1,200/year.
Ad spend: Total paid advertising budget across all platforms. If you spend $500/month on Facebook and Instagram ads, that’s $6,000/year.
Content creation costs: Any outsourced content — photography, videography, graphic design, copywriting. If you hire a photographer quarterly at $300 per session, that’s $1,200/year.
Total investment example: $19,500 (time) + $1,200 (tools) + $6,000 (ads) + $1,200 (content creation) = $27,900/year total social media investment.
Calculating Your Social Media Return
Track every client who came from social media over the past year. Sum their commission revenue. If you closed four transactions from social media-sourced leads with an average commission of $12,000, your social media return is $48,000.
ROI calculation: ($48,000 return – $27,900 investment) ÷ $27,900 investment = 72% ROI. This means for every dollar invested in social media, you got $1.72 back. That’s a strong, measurable return that justifies continued (and potentially increased) investment.
Comparing Across Marketing Channels
The real power of ROI calculation is comparison. When you know your social media CPA is $6,975 per client (from the example above: $27,900 ÷ 4 clients) and your Zillow Premier Agent CPA is $12,000 per client (hypothetical), you know where to reallocate budget. The channel with the lowest CPA and highest ROI should get the most investment — and you can only make that decision with accurate data.
Building Your Analytics Dashboard
Checking analytics shouldn’t be a time-consuming research project. Build a simple dashboard that you review weekly (10 minutes) and monthly (30 minutes).
Weekly Check (10 Minutes)
Review: total reach across platforms (is it growing?), top-performing posts from the past week (what worked?), DM conversations initiated and responses received, any new leads from social media (logged in CRM), and engagement rate trends (up, down, or stable?).
The weekly check keeps you informed and allows you to make small adjustments — creating more content like your top performers, adjusting your posting times, or shifting emphasis to the platforms that are producing the best results.
Monthly Review (30 Minutes)
Review: month-over-month growth in reach, followers, and engagement, total leads generated from social media (by platform and content type), lead magnet performance (downloads, conversion rates), paid advertising performance (cost per lead, cost per result by campaign), progress toward quarterly and annual goals, and content performance patterns (which pillars and formats drive the most business-relevant metrics).
The monthly review is where strategic decisions get made. If Instagram is generating ten times more leads than LinkedIn, consider whether to double down on Instagram or investigate why LinkedIn isn’t performing. If educational content generates more saves and shares than listing content, create more educational content. Let the data guide your strategy.
Quarterly Business Review
Once per quarter, conduct a deeper analysis: revenue attribution (which clients came from social media, and what’s their total commission value?), ROI calculation (updated with current data), year-over-year comparison (if you have historical data), competitive analysis (how does your social media presence compare to top agents in your market?), and strategic planning (what should change next quarter based on the data?). This quarterly review connects your social media analytics to your business planning — ensuring that your marketing strategy is driven by evidence, not gut feeling.
Common Analytics Mistakes
Measuring only vanity metrics. Followers, likes, and impressions feel good but don’t predict revenue. An agent who tracks only these metrics can spend a year building a social media presence that generates no business — and not realize it until it’s too late. Always connect leading indicators to conversion metrics and revenue metrics.
Not tracking lead source. If you don’t ask every lead “How did you find me?” and record the answer, you can’t calculate ROI for any marketing channel. Make this question a non-negotiable part of your intake process for every new lead — and tag the source in your CRM for future analysis.
Drawing conclusions from insufficient data. A single post that gets low engagement doesn’t mean the topic or format is bad — it might have been posted at a suboptimal time, or the algorithm just didn’t distribute it widely. Make strategic decisions based on patterns across dozens of posts, not individual data points. Give any strategy at least 90 days before evaluating its effectiveness.
Not connecting social media data to CRM data. Social media analytics and your CRM should talk to each other. When a lead comes in through Instagram, that should be tagged in your CRM. When that lead becomes a client six months later, the revenue should be traceable back to the original Instagram source. Without this connection, you can’t calculate true ROI.
Analyzing without acting. Analytics are only valuable if they inform decisions. If you review your data and conclude that video content outperforms image posts by three to one — but then continue posting the same ratio of images to videos — the analytics were wasted. Every data review should produce at least one actionable change to your strategy.
Your Analytics and ROI Action Plan
Week 1 — Set up tracking: Ensure you have business accounts on all platforms (which enable analytics). Install the Meta Pixel on your website. Set up UTM parameters for links from social media so you can track social traffic in Google Analytics. Add a “How did you find me?” field to your lead intake process. Tag all existing social media leads in your CRM with their source platform.
Week 2 — Build your dashboard: Create a simple tracking spreadsheet or document with your key metrics organized by tier (leading indicators, conversion metrics, revenue metrics). Record your current baseline numbers. Set goals for each metric for the next 90 days.
Ongoing — Weekly and monthly reviews: Spend 10 minutes weekly reviewing your dashboard and noting top performers. Spend 30 minutes monthly doing a deeper analysis and making strategic adjustments. Track everything in your CRM.
Quarter 1 — Calculate your first ROI: After 90 days of consistent tracking, calculate your social media investment (time + tools + ads + content costs) and your social media return (revenue from social media-sourced clients). This first calculation gives you a baseline ROI to improve against in future quarters.
The agents who track their social media analytics and calculate their ROI make better marketing decisions, allocate their time and money more efficiently, and ultimately generate more business from less effort. Data doesn’t replace creativity and consistency — it amplifies them by showing you exactly where your creativity and consistency are paying off.
SocialAgnt’s analytics dashboard shows you what’s working across Instagram, Facebook, TikTok, LinkedIn, YouTube, and Google Business Profile without switching between apps. See your reach, engagement, and growth trends in one place — so you can make data-driven decisions that grow your real estate business. Start your free account today.
Ready to save 5+ hours per week on social media?
SocialAgnt helps real estate agents schedule posts, create AI content, and grow their brand across 7 platforms. Try it free for 14 days.
